

No-code stock & crypto screener — pick the shapes, group them, that's your scan
Screeners used to mean learning a formula language first. Here you pick the chart shapes you look for and group them with AND/OR — that is the scan itself. A walkthrough with real screenshots, from the first screen to the result list.
Pick the chart shapes you look for, group them with AND/OR, and that is your scan. No formulas, no code, nothing to install. This is a walkthrough of the actual screen — what it looks like, and what combinations it can express — with real screenshots.
What a screener is — a sieve over the whole market
A screener is a sieve you hold over the market: "keep only the stocks that look like this." Instead of paging through thousands of tickers, you read what stays in the sieve.
Until now that sieve came with a wall. Broker screeners speak in formula languages and function lists; most web screeners assume you already know the indicator jargon; crypto exchanges rarely ship a screener at all. Between "I want to see stocks with a double bottom" and writing that as a formula, most people give up.
A no-code screener removes that distance. Every shape already has a name and a picture, and picking one is a click.
The first screen
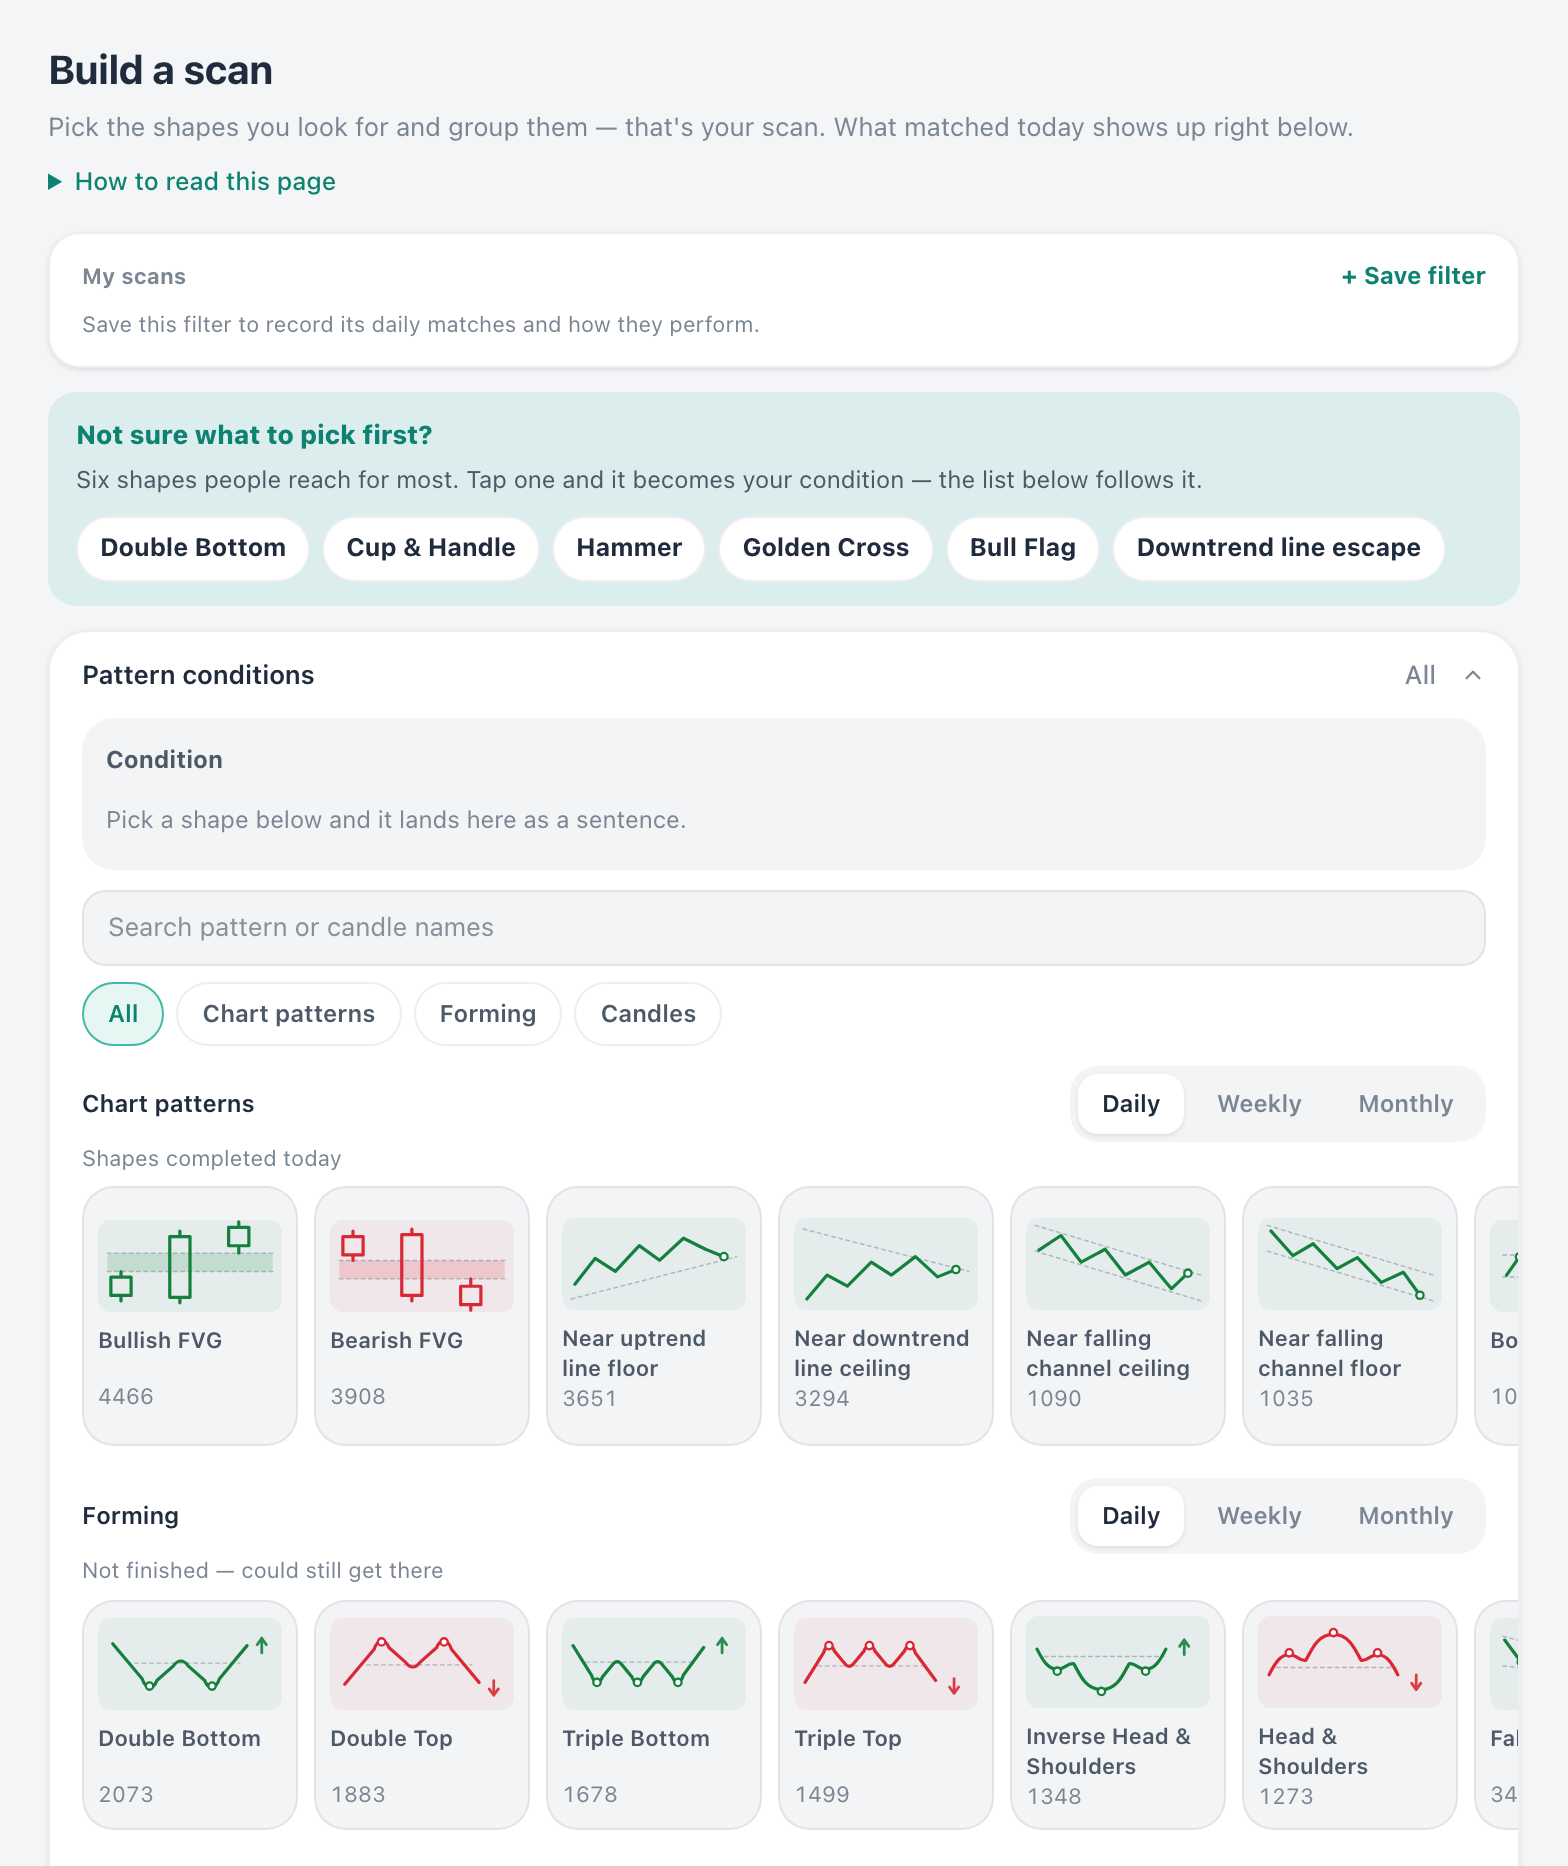
Not sure where to start? Tap a starter — Double Bottom, Cup & Handle, Hammer, Golden Cross and other shapes people reach for most. The moment you tap one it becomes your condition, and the list below follows it.
The gallery has three branches: shapes completed today (chart patterns), forming (not finished, but the structure could still get there), and candles (one bar's shape and volume). Each card shows how many stocks carry that shape right now, so you know how common it is before you tap. Daily, weekly and monthly bars switch with one button.
Conditions stack up as a sentence — AND and OR
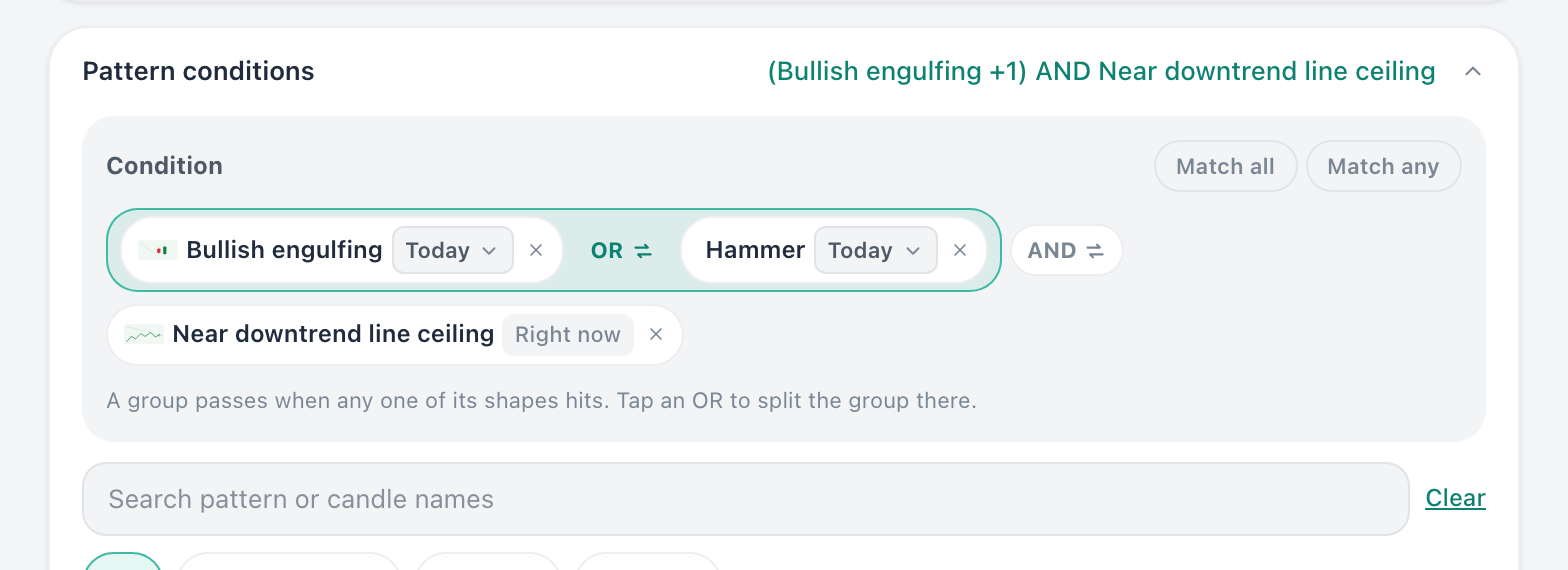
In plain words, the condition above says: price has come up against the line that kept pushing it down, and at that spot a bullish engulfing or a hammer bar printed.
- Bullish engulfing — the next day's up bar swallows the previous down bar whole
- Hammer — pushed down during the day, pulled back up, leaving a long lower tail
- Near downtrend line ceiling — price has reached the line drawn by falling highs
Grouping is a click too. Pick another shape and it joins with AND; tap the connector and it flips to OR, bundling the two sides into one group. A group passes when any one of its shapes hits — parentheses, drawn on screen. Each condition can carry its own time window, from "today" to "within a month."
Number conditions are clicks too — RSI, volume, moving averages
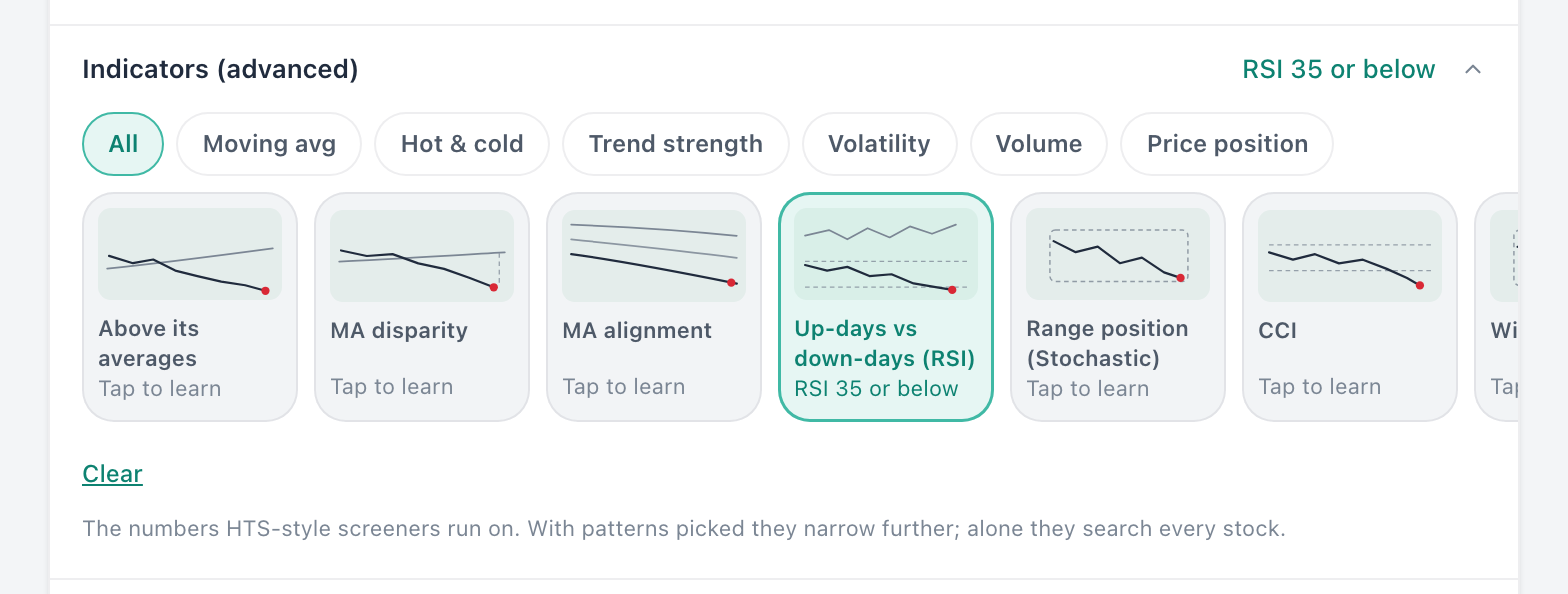
When shapes alone are not enough, add an indicator: RSI (recent up-strength versus down-strength — lower means colder), distance from a moving average, volume multiples, volatility. You do not write a formula; you tap a card and set the threshold with a slider. With shapes picked, only stocks matching both remain; indicators alone search the whole market.
Results live right below, on the same screen
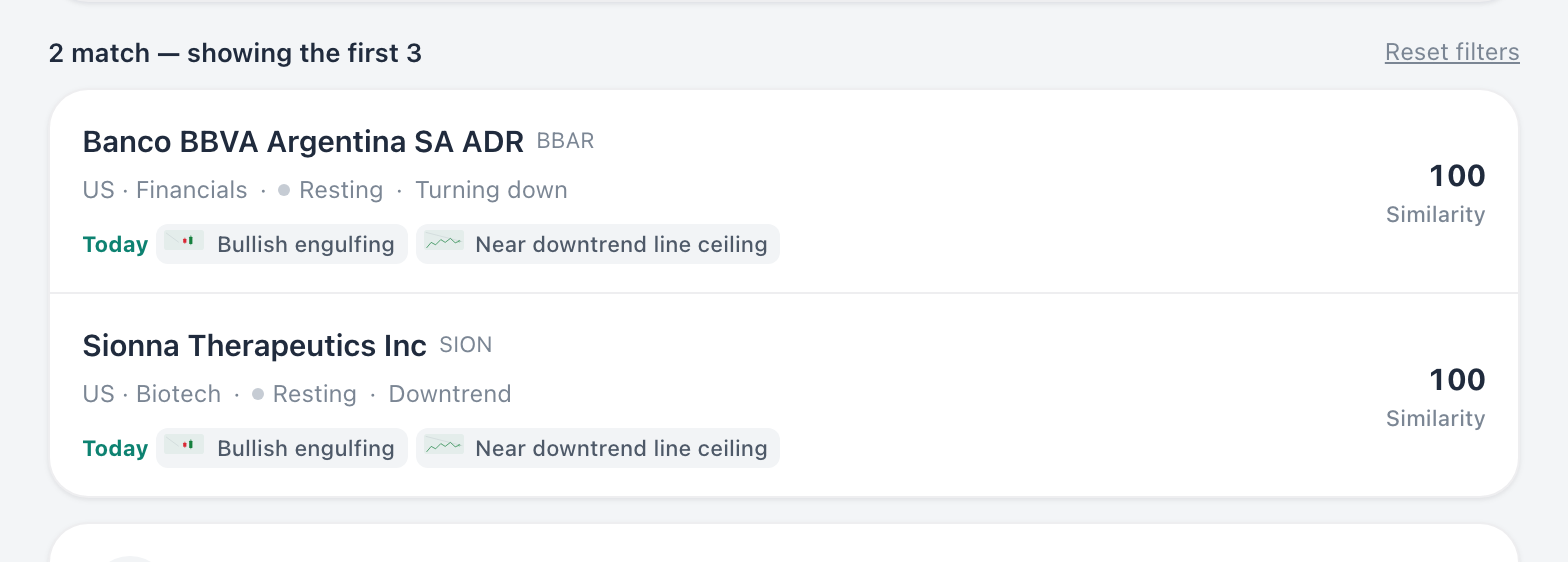
Every time you change a condition, the list rewrites itself in place. Each row says which signals fired, and tapping a stock opens its chart with those signals already drawn on it. Coverage is Korean and US stocks plus crypto — about 8,000 tickers.
Give a combination you like a name and save it. A saved scan runs on its own every day and records what it picked; flip its bell and an email arrives on days it matches. You can also rewind to past days the scan matched and practice on them.
Open the exact combination from these screenshots — the screen and a preview of the results are open without signing in; a free account opens the full list.
A scan is not a formula — it is picking shapes
Screeners were hard not because the thinking was hard, but because the language was. Pick the shapes you look for, group them, and that is your scan — code never enters the picture. If this is your first time, start from one starter shape on the scan builder, and when a shape's name is unfamiliar, the chart pattern dictionary explains it with a picture.